Assignment I
Cryptocurrency Analysis Report
Tableau
Cryptocurrency Data Visualization

About The Data
I have data of 10 popular Crypto-Currencies which include Bitcoin, Ethereum, Ethereum Classic, Dash, Doge, Cardano, Ripple, Decred, Monero. The data contains the date wise transaction volume, adjusted transaction volume, transaction count, marketcap, price, exchange volume, fees, active addresses, median transaction value, median fee and payment count. The data contains the entries from the date of the listing of that particular Crpto-Currency till December 2019.
Source of Data
I have taken this data from the website ”coinmetrics.io” which was available for all on the Data World website. The link for the Data World :- https://data.world/crispydata/bitcoin-historical- data. 2019.
Tableau Workbook

Visualization Using Python
- Python provides various libraries that come with different features for visualizing data. All these libraries come with different features and can support various types of graphs.
- We will be using Matplotlib and Seaborn in our project.
- We will be using above Python tools to visualize the sales of different food items on different dates in different locations


Visualization Using D3
Source Code of D3
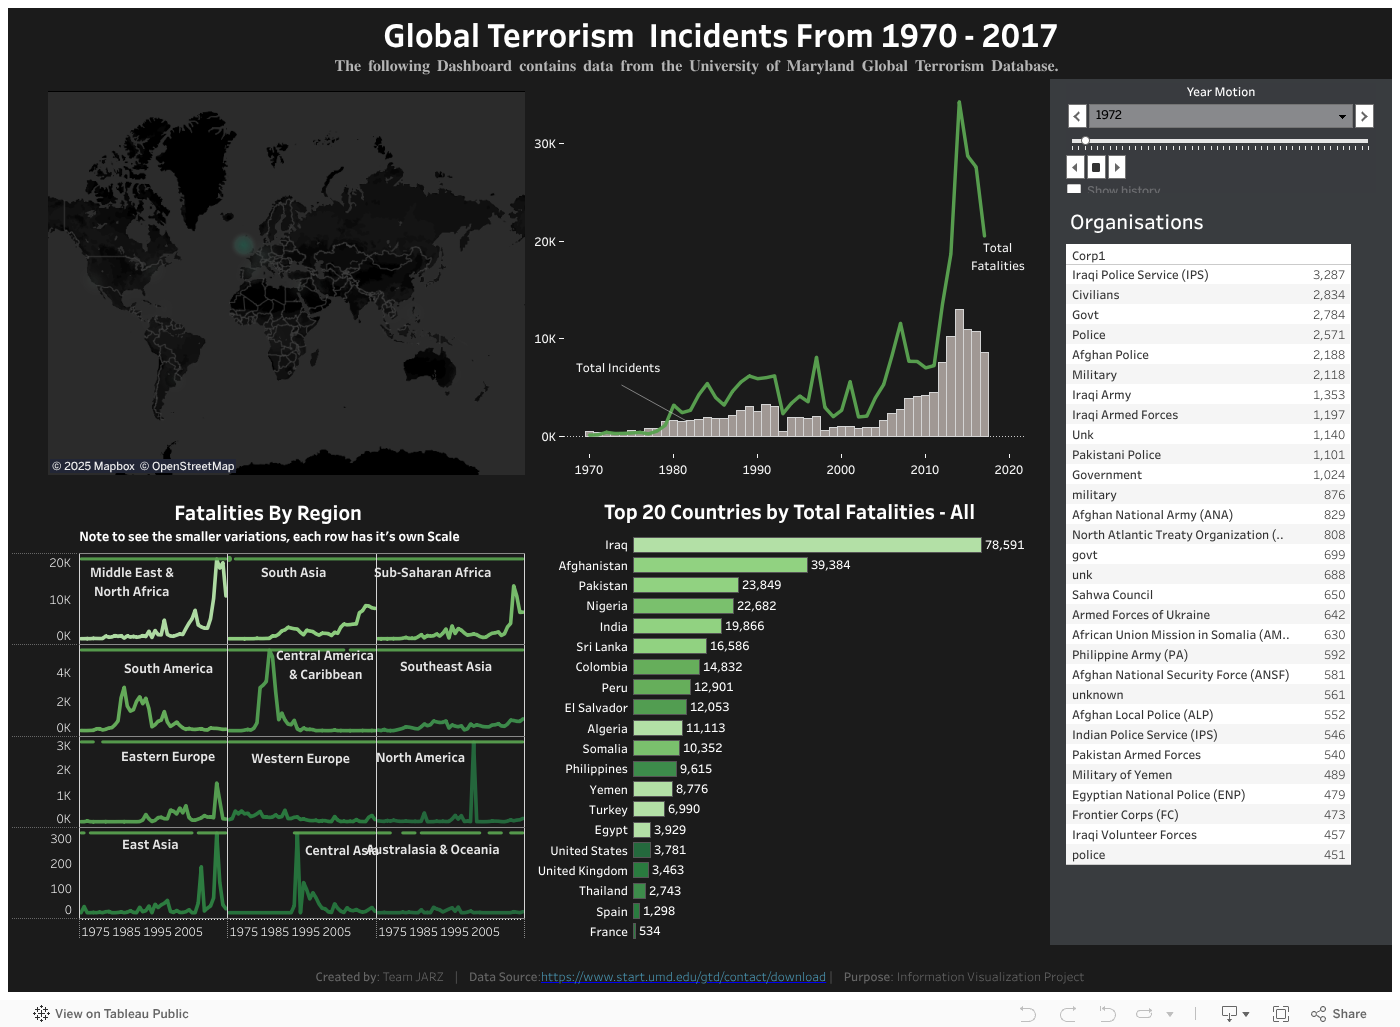
Global Terrorism Index